|
rbmatlab
1.16.09
|
|
rbmatlab
1.16.09
|
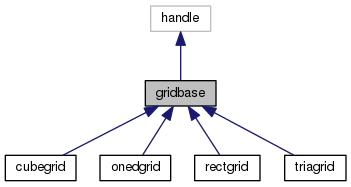
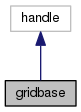
Base class for all grid classes.
Definition at line 17 of file gridbase.m.
Public Member Functions | |
| gridbase () | |
| default constructor for gridbase | |
| function res = | check_consistency () |
| function checking the consistency of a polygonal grid, i.e. checking, whether the edge centroids correspond (implicit neighbour-index test) More... | |
| function | display () |
| default implementation for display method for unstructured polygonal grids. is used by rectgrid and triagrid | |
| function F = | edge_quad_eval (elids, edgeids, degree, FF) |
| Compute an edge integral of a scalar function in various edges simultaneously. Approximation by Gauss-quadratures are performed. More... | |
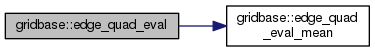
| function F = | edge_quad_eval_mean (elids, edgeids, degree, FF) |
| Compute an edge-average integral of a scalar function in various edges simultaneously. Approximation by Gauss-quadratures are performed. More... | |
| function PP = | edge_quad_points (elids, edgeids, degree) |
| get the evaluation points for a quadrature over edges of the given grid. More... | |
| function [
P1 , P2 ] = | get_edge_points (elids, edgeids) |
| function extracting edge coordinates from the grid. More... | |
| function ENBI = | get_enbi (edge, tstep) |
function assembling a matrix with the 5 neighbour's cell indices that are needed in order to compute the gradient over the edge given by edge in each row. see also the sketch below. More... | |
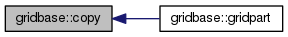
| function gridp = | gridpart (eind) |
function extracting a part of a triagrid or rectgrid defined by the given element indices in the vector eind. More... | |
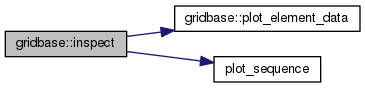
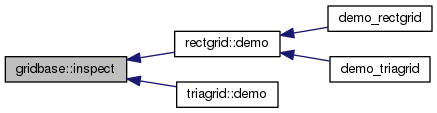
| function | inspect (params) |
| function plotting various properties of the current grid. More... | |
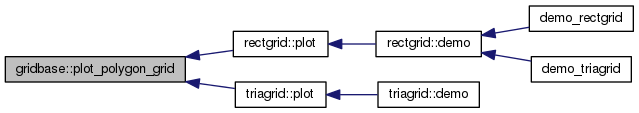
| function p = | plot_polygon_grid (params) |
| plot method for a 2D polygonal grid. This routine can be used for triangular and rectangular grids. More... | |
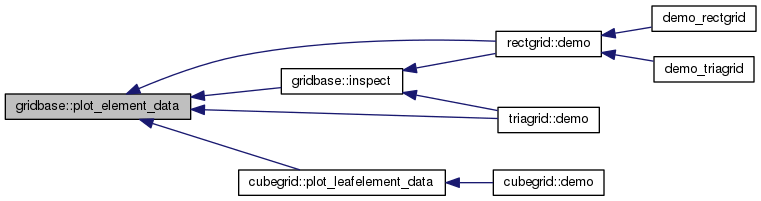
| function p = | plot_element_data (data, plot_params) |
| plot method for a 2d polygonal grid and elementwise constant data routine can be used for triangular and rectangular grids. More... | |
| function | plot_element_data_sequence (data, plot_params) |
| plot of a sequence of element_data on the given grid (constructed if empty). performs simple call of plot_data_sequence. More... | |
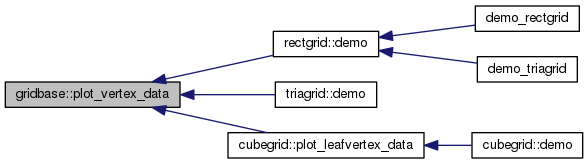
| function p = | plot_vertex_data (data, params) |
| plot method for vertex data on a 2D polygonal grid. More... | |
| function gridbase grid = | set_boundary_types (params) |
| function setting the boundary types of a polygonal grid. More... | |
| virtual function gridbase gcopy = | copy () |
| returns a deep copy object of the grid implementation More... | |
Public Attributes | |
| nelements | |
| number of overall elements (leaf + nonleaf) | |
| nvertices | |
| number of vertices | |
| nneigh | |
| number of neighbor elements | |
| A | |
| vector of element area | |
| Ainv | |
| vector of inverted element area | |
| VI | |
matrix of vertex indices: VI(i,j) is the global index of j-th vertex of element i | |
| X | |
| vector of vertex x-coordinates | |
| Y | |
| vector of vertex y-coordinates | |
| CX | |
| vector of centroid x-values | |
| CY | |
| vector of centroid y-values | |
| NBI | |
NBI(i,j) = element index of j-th neighbour of element i boundary faces are set to -1 or negative values are requested by params.boundary_type | |
| INB | |
INB(i,j) = local edge number in NBI(i,j) leading from element NBI(i,j) to element i, i.e. satisfying NBI(NBI(i,j), INB(i,j)) = i | |
| EL | |
EL(i,j) = length of edge from element i to neighbour j | |
| DC | |
DC(i,j) = distance from centroid of element i to NB j for boundary elements, this is the distance to the reflected element (for use in boundary treatment) | |
| NX | |
NX(i,j) = x-coordinate of unit outer normal of edge from el i to NB j | |
| NY | |
NY(i,j) = y-coordinate of unit outer normal of edge from el i to NB j | |
| ECX | |
ECX(i,j) = x-coordinate of midpoint of edge from el i to NB j | |
| ECY | |
ECY(i,j) = x-coordinate of midpoint of edge from el i to NB j | |
| SX | |
| vector of x-coordinates of point \(S_i\) (for rect: identical to centroids) More... | |
| SY | |
| vector of y-coordinates of point \(S_i\) (for rect: identical to centroids) More... | |
| ESX | |
ESX(i,j) = x-coordinate of point \(S_ij\) on edge el i to NB j | |
| ESY | |
ESY(i,j) = x-coordinate of point \(S_ij\) on edge el i to NB j | |
| DS | |
DS(i,j) = distance from \(S_i\) of element i to \(S_j\) of NB j for boundary elements, this is the distance to the reflected element (for use in boundary treatment) | |
| hmin | |
| minimal element-diameter | |
| alpha | |
| geometry bound (simultaneously satisfying \[\alpha h_i^d \leq A(T_i),\] \[\alpha \text{diam}(T_i) \leq h_i^{d-1}\] and \[\alpha h_i \leq \text{distance(midpoint i to any neighbour)}\] | |
| JIT | |
Jacobian inverse transposed JIT(i,:,:) is a 2x2-matrix of the Jacobian Inverse Transposed on element i | |
| function res = gridbase.check_consistency | ( | ) |
function checking the consistency of a polygonal grid, i.e. checking, whether the edge centroids correspond (implicit neighbour-index test)
| res | boolean value which is true if the check succeeds, or false if it fails. |
Definition at line 18 of file check_consistency.m.
|
pure virtual |
| function F = gridbase.edge_quad_eval | ( | elids, | |
| edgeids, | |||
| degree, | |||
| FF | |||
| ) |
Compute an edge integral of a scalar function in various edges simultaneously. Approximation by Gauss-quadratures are performed.
Computes quadratures approximating integrals
\[ \int_{e(i_k,j_k)} f(s) ds \]
over edges \(e(i_k, j_k)\) for \(k=1,...,K\), where \(i_k\) are cell indices and \(j_k\) denotes local edge numbers.
| elids | vector of length \(K\) of cell indices \(i_k\). |
| edgeids | vector of length \(K\) of local edge indices \(j_k\). |
| degree | scalar defining the degree of the quadrature rule. |
| FF | matrix of size degree x grid.nedges holding evaluations of a function \(f:\mathbb{R} \to \mathbb{R}\) in quadrature points. This is usually obtained by a callFF=f(edge_quad_points(elids,
edgeids, degree)
|
| F | vector of length \(K\) holding the quadrature evaluations on edges \(e(i_k, j_k)\). |
Definition at line 18 of file edge_quad_eval.m.
| function F = gridbase.edge_quad_eval_mean | ( | elids, | |
| edgeids, | |||
| degree, | |||
| FF | |||
| ) |
Compute an edge-average integral of a scalar function in various edges simultaneously. Approximation by Gauss-quadratures are performed.
Computes quadratures approximating integrals
\[ \frac{1}{|e(i_k,j_k)|} \int_{e(i_k,j_k)} f(s) ds \]
over edges \(e(i_k, j_k)\) for \(k=1,...,K\), where \(i_k\) are cell indices and \(j_k\) denotes local edge numbers.
| elids | vector of length \(K\) of cell indices \(i_k\). |
| edgeids | vector of length \(K\) of local edge indices \(j_k\). |
| degree | scalar defining the degree of the quadrature rule. |
| FF | matrix of size degree x grid.nedges holding evaluations of a function \(f:\mathbb{R} \to \mathbb{R}\) in quadrature points. This is usually obtained by a callFF=f(edge_quad_points(elids,
edgeids, degree)
|
| F | vector of length \(K\) holding the quadrature evaluations on edges \(e(i_k, j_k)\). |
Definition at line 18 of file edge_quad_eval_mean.m.
| function PP = gridbase.edge_quad_points | ( | elids, | |
| edgeids, | |||
| degree | |||
| ) |
get the evaluation points for a quadrature over edges of the given grid.
Given a list of edges \(\{e(i_k, j_k)\}_{i=1}^K\), where \(i_k\) are cell indices and \(j_k\) denotes local edge numbers, this function computes quadrature points
\[\left( x_k^1, \ldots, x_k^Q \right)\]
for each \(k=1,\ldots, K\).
| elids | vector of length \(K\) of cell indices \(i_k\). |
| edgeids | vector of length \(K\) of local edge indices \(j_k\). |
| degree | scalar defining the degree of the quadrature rule. |
| PP | matrix of size \(K \times Q\) holding the quadrature for each edge. This can be used as last argument for either edge_quad_eval() or edge_quad_eval_mean(). |
Definition at line 18 of file edge_quad_points.m.
| function [ P1 , P2 ] = gridbase.get_edge_points | ( | elids, | |
| edgeids | |||
| ) |
function extracting edge coordinates from the grid.
Given a grid of dimension \(d\), this function returns the two extremal coordinates of edges \(\{e(i_k, j_k)\}_{k=1}^K\) assuming that the edge is \((d-1)\)-dimensional cube. Here, \(i_k\) are cell indices and \(j_k\) denotes local edge numbers for all \(k=1,...,K\)
| elids | vector of length \(K\) of cell indices \(i_k\). |
| edgeids | vector of length \(K\) of local edge indices \(j_k\). |
| P1 | matrix of size \(K x d\) holding the first extremal coordinate of the edges \(e(i_k, j_k)\). |
| P2 | matrix of size \(K x d\) holding the second extremal coordinate of the edges \(e(i_k, j_k)\). |
Definition at line 18 of file get_edge_points.m.
| function ENBI = gridbase.get_enbi | ( | edge, | |
| tstep | |||
| ) |
function assembling a matrix with the 5 neighbour's cell indices that are needed in order to compute the gradient over the edge given by edge in each row. see also the sketch below.
 Example: edge == 1:
   N   |   NE                        ENBI(:,2) = N  | ENBI(:,5) = NE
 ------|-------   <-- nb_ind(0)     ----------------|-----------------
  main |   E                         ENBI(:,1)      | ENBI(:,4)
 ------|-------   <-- nb_ind(1)     ----------------|-----------------
   S   |   SE                        ENBI(:,3)      | ENBI(:,6)
       ^
      edge
Martin Drohmann 05.03.2008
| edge | edge |
| tstep | tstep |
| ENBI | ENBI |
Definition at line 18 of file get_enbi.m.
| function gridbase gridp = gridbase.gridpart | ( | eind | ) |
function extracting a part of a triagrid or rectgrid defined by the given element indices in the vector eind.
-10gridp would be really identical to the result generated by the constructor on the subset of points.| eind | vector of cell indices which shall be extracted from the grid. |
| gridp | the partial grid with extracted cells eind. |
nelements — nelements nvertices — nvertices A — A Ainv — Ainv X — X Y — Y VI — VI CX — CX CY — CY NBI — NBI INB — INB EL — EL DC — DC NX — NX NY — NY ECX — ECX ECY — ECY SX — SX SY — SY ESX — ESX ESY — ESY DS — DS Definition at line 18 of file gridpart.m.
| function gridbase.inspect | ( | params | ) |
function plotting various properties of the current grid.
| params | structure holding control fields for the functions plot_element_data() and plot_sequence() used by this method. |
Definition at line 18 of file inspect.m.
| function p = gridbase.plot_element_data | ( | data, | |
| plot_params | |||
| ) |
plot method for a 2d polygonal grid and elementwise constant data routine can be used for triangular and rectangular grids.
By default a patch plot is performed.
| data | is assumed to be a vector of length grid.nelements with element-wise scalar values |
| plot_params | parameter structure controlling the output of the plot. For time dependent problems plot_params are often passed to plot_element_data() and plot_sequence(). |
| p | is the list of handles to the graphics primitives |
shrink_factor — if this flag is given, the elements are plotted shrinked axis_equal — if this flag is set, set axis to equal scale no_lines — if this flag is set, no lines are drawn show_colorbar — if this flag is set, a colorbar is drawn (default 1) colorbar_location — string specifying the position of the colorbar, e.g. South,EastOutside (default), etc. clim — if this 2-vector is set, the colorbar is set to these values geometry_transformation — type of transformation function that is to be applied on the geometry (default none) postprocess — function data = f(data,[CX,CY],plot_params) postprocessing the given data before it is plotted. colormap — user-defined colormap plot_type — string sepcifying wether a patch (default) or a contour plot is created. line_width — specifyies the line width of plotted lines, e.g. in a contour plot. contour_lines — number of contour_lines if plot_type is set to contour. The default is 0 and means that the number is determined automatically. Definition at line 18 of file plot_element_data.m.
| function gridbase.plot_element_data_sequence | ( | data, | |
| plot_params | |||
| ) |
plot of a sequence of element_data on the given grid (constructed if empty). performs simple call of plot_data_sequence.
| data | data |
| plot_params | parameter structure controlling the output of the plot. For time dependent problems plot_params are often passed to plot_element_data() and plot_sequence(). |
Definition at line 18 of file plot_element_data_sequence.m.
| function p = gridbase.plot_polygon_grid | ( | params | ) |
plot method for a 2D polygonal grid. This routine can be used for triangular and rectangular grids.
A line plot is performed as default.
| params | optional structure holding fields controlling the plot output. |
| p | This is the list of handles to the graphics primitives |
axis_tight — axis tightcolor — RGB vector of line/patch color shrink_factor — if this flag is given, the elements are plotted shrinked plot_patch — if this flag is set the plot is done by colored patches axis_equal — if this flag is set, set axis to equal scale Definition at line 18 of file plot_polygon_grid.m.
| function p = gridbase.plot_vertex_data | ( | data, | |
| params | |||
| ) |
plot method for vertex data on a 2D polygonal grid.
For example a \(P1\) functions routine can be used for triangular and rectangular grids. A patch plot is performed as default. In case of rectangular elements, no true bilinear interpolation is performed, but the patch is divided into triangles.
| data | a vector of length grid.nvertices with nodewise scalar values. |
| params | optional structure holding fields controlling the plot output. |
| p | This is the list of handles to the graphics primitives |
plot_mode — plot mode view — viewshrink_factor — if this flag is given, the elements are plotted shrinked axis_equal — if this flag is set, set axis to equal scale no_lines — if this flag is set, no lines are drawn show_colorbar — if this flag is set, a colorbar is drawn (default 1) colorbar_location — string specifying the position of the colorbar, e.g. South,EastOutside (default), etc. clim — if this 2-vector is set, the colorbar is set to these values Definition at line 18 of file plot_vertex_data.m.
| function gridbase grid = gridbase.set_boundary_types | ( | params | ) |
function setting the boundary types of a polygonal grid.
For rectgrid's this is already done in the constructor. For triagrid this can be performed explicitly here. Existing boundary settings are painted by rectangles The edges with midpoints within such a rectangle are marked accordingly.
-1 is treated as Dirichlet in the numerics-2 is treated as Neumann in the numericsbnd_rect_corner1 and bnd_rect_corner2 in case of different boundary types on the domain.| params | params |
| grid | grid |
bnd_rect_index — bnd rect index bnd_rect_corner1 — bnd rect corner1 bnd_rect_corner2 — bnd rect corner2 Definition at line 18 of file set_boundary_types.m.
| gridbase.SX |
vector of x-coordinates of point \(S_i\) (for rect: identical to centroids)
for diffusion-discretization with FV-schemes, points \(S_i\) must exist, such that \(S_i S_j\) is perpendicular to edge \(i j\) the intersection are denoted \(S_ij\)
Definition at line 176 of file gridbase.m.
| gridbase.SY |
vector of y-coordinates of point \(S_i\) (for rect: identical to centroids)
for diffusion-discretization with FV-schemes, points \(S_i\) must exist, such that \(S_i S_j\) is perpendicular to edge \(i j\) the intersection are denoted \(S_ij\)
Definition at line 189 of file gridbase.m.
 1.8.8
1.8.8