|
rbmatlab
1.16.09
|
|
rbmatlab
1.16.09
|
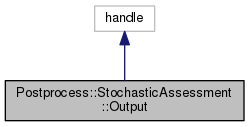
result class for computations executed by an Postprocess.StochasticAssessment.Assessment object.
This class provides methods to transform and visualize the gathered data for publication in LaTeX/Tikz documents.
Public Member Functions | |
| Output (values,Postprocess.StochasticAssessment.Assessment assessment) | |
| Constructor. More... | |
| function | plot_landscape () |
| plots a two dimensional error landscape in case of two dimensional plot_fields More... | |
| function | print_table (datafile) |
| prints out a CSV table with gathered data. More... | |
| function | print_landscape (datafile, fieldname) |
| equivalent to the plot_landscape() function put prints out a table which can be interpreted e.g. by pgfplots/Tikz. More... | |
| function | print_3d_curve (datafile, fieldname) |
| equivalent to the print_landscape() function put prints out a table which can be interpreted for a 3d-curve plot e.g. by pgfplots/Tikz. More... | |
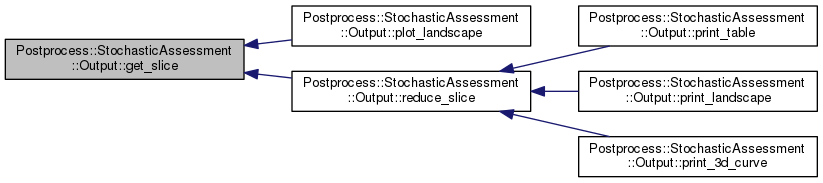
| function slic = | get_slice (fieldname, cell_range, struct_range) |
| helper function slicing a field in the values attribute More... | |
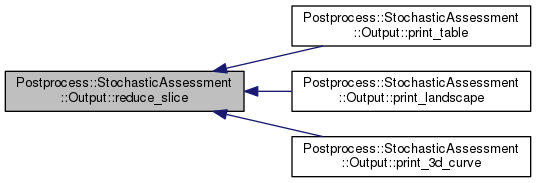
| function rslice = | reduce_slice (red_func, fieldname, cell_range, struct_range, direction) |
| extends the get_slice() function by also applying a reduction function on each matrix entry. More... | |
| function | merge (Postprocess.StochasticAssessment.Output other) |
| helper function merging this Output object with another one. More... | |
Public Attributes | |
| values | |
| values computed by Postprocess.StochasticAssessment.Assessment More... | |
| rd_conds | |
| cell array of all condition numbers of reduced simulaton system matrices. | |
| rtime_est = {""} | |
| time for the computation of the error estimator. By default this is not set. More... | |
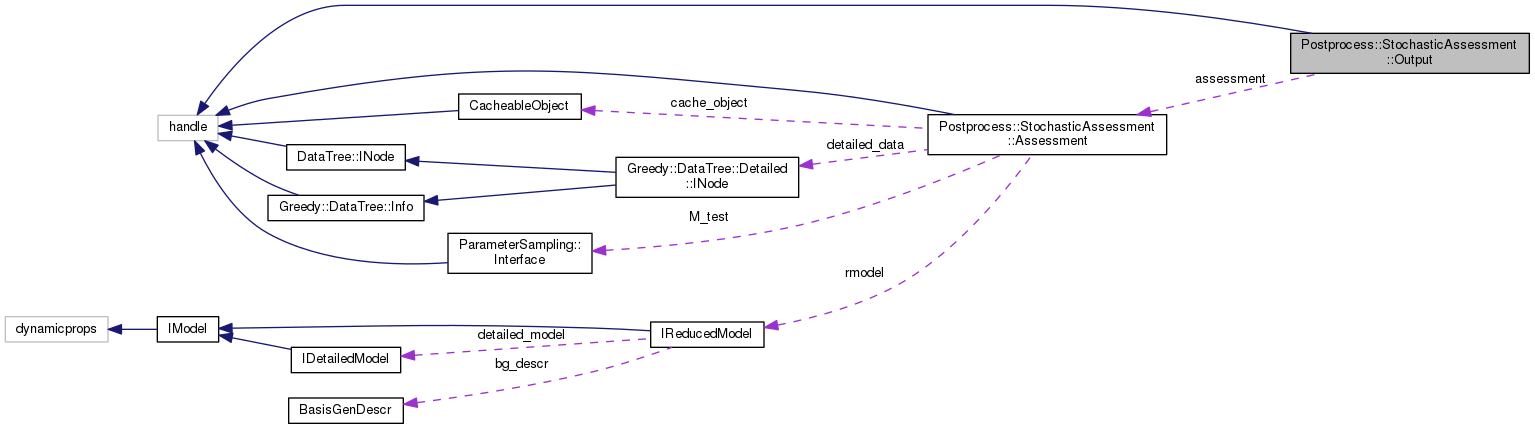
| Assessment | assessment |
| the object with which the values are generated More... | |
| error_bound = 1 | |
| maxmimum error values to be plotted. Above this values error display is cropped. More... | |
| estimator_bound = 100 | |
| maxmimum estimator values to be plotted. Above this values error display is cropped. More... | |
| stab_limit = 1e-2 | |
| define stability-region as error being smaller than sqrt(diffmax * area), e.g. diffmax = 4, area = 2e-7 stability region More... | |
| Postprocess.StochasticAssessment.Output.Output | ( | values, | |
| Postprocess.StochasticAssessment.Assessment | assessment | ||
| ) |
Constructor.
| values | the structure with the gathered data by the Postprocess.StochasticAssessment.Assessment object |
| assessment | the generating object |
| function slic = Postprocess.StochasticAssessment.Output.get_slice | ( | fieldname, | |
| cell_range, | |||
| struct_range | |||
| ) |
helper function slicing a field in the values attribute
| fieldname | name of the field in the values attributed to be sliced |
| cell_range | cell indices to be extracted from the field. If empty all cell entries are returned Default: [] |
| struct_range | Usually the values attribute is a cell of structure arrays. arrays. This range defines a slice in the structure array. If empty all array entries are returned. Default: [] |
| slic | the sliced values attribute |
Definition at line 431 of file Output.m.
| function Postprocess.StochasticAssessment.Output.merge | ( | Postprocess.StochasticAssessment.Output | other | ) |
helper function merging this Output object with another one.
values.max_Delta is all Inf, copy max_Delta and max_Delta_ind from other.values.max_err is all Inf, copy max_err and max_err_ind from other.rconds, dconds or rtime_est is empty, copy it from otherrtime, rrtime or dtime is set to all-NaN, copy it from otherthis and other have valid rtime (i.e. not-Nan) and only one of both has computed estimators, compute rtime_est by subtracting one from the other.| other | another object to be merged into this one. |
values — values assessment.compute_estimates — assessment.compute estimates rtime_est — rtime est rd_conds — rd conds | function Postprocess.StochasticAssessment.Output.plot_landscape | ( | ) |
plots a two dimensional error landscape in case of two dimensional plot_fields
Definition at line 133 of file Output.m.

| function Postprocess.StochasticAssessment.Output.print_3d_curve | ( | datafile, | |
| fieldname | |||
| ) |
equivalent to the print_landscape() function put prints out a table which can be interpreted for a 3d-curve plot e.g. by pgfplots/Tikz.
This function can be used to display certain curves on the error landscape generated by print_landscape().
An example for a pgfplots graphics that can interpret the table output is shown in the following code snippet:
| datafile | a string specifying the path and filename of the data table to be stored |
| fieldname | the fieldname in the values attribute that shall be plotted Default: max_err |
Definition at line 382 of file Output.m.

| function Postprocess.StochasticAssessment.Output.print_landscape | ( | datafile, | |
| fieldname | |||
| ) |
equivalent to the plot_landscape() function put prints out a table which can be interpreted e.g. by pgfplots/Tikz.
An example for a pgfplots graphics that can interpret the table output is shown in the following code snippet:
| datafile | a string specifying the path and filename of the data table to be stored |
| fieldname | the fieldname in the values attribute that shall be plotted Default: max_err |
Definition at line 340 of file Output.m.

| function Postprocess.StochasticAssessment.Output.print_table | ( | datafile | ) |
prints out a CSV table with gathered data.
An example for a pgfplotstable graphic that can interpret the table output is shown in the following code snippet:
This function prints out a table with data for the average, min and max values of
| datafile | a string specifying the path and filename of the data table to be stored |
Definition at line 196 of file Output.m.

| function rslice = Postprocess.StochasticAssessment.Output.reduce_slice | ( | red_func, | |
| fieldname, | |||
| cell_range, | |||
| struct_range, | |||
| direction | |||
| ) |
extends the get_slice() function by also applying a reduction function on each matrix entry.
| red_func | function pointer who is applied to each matrix entry in the slice, e.g. '@max or @mean' |
| fieldname | name of the field in the values attributed to be sliced |
| cell_range | cell indices to be extracted from the field. If empty all cell entries are returned. Default: [] |
| struct_range | Usually the values attribute is a cell of structure arrays. arrays. This range defines a slice in the structure array. If empty all array entries are returned. Default: [] |
| direction | integer specifying in which direction a matrix shall be reduced. In case it is equal to 2, the matrix is transposed before red_func is applied. Default: 1 |
| rslice | the sliced and reduced values attribute |
Definition at line 462 of file Output.m.

| Postprocess.StochasticAssessment.Output.assessment |
| Postprocess.StochasticAssessment.Output.error_bound = 1 |
| Postprocess.StochasticAssessment.Output.estimator_bound = 100 |
| Postprocess.StochasticAssessment.Output.rtime_est = {""} |
| Postprocess.StochasticAssessment.Output.stab_limit = 1e-2 |
define stability-region as error being smaller than sqrt(diffmax * area), e.g. diffmax = 4, area = 2e-7 stability region
If the averaged error exceeds this value, the visualization is cropped here. This happens especially for small reduced basis sizes. (Default = 1e-2)
Default: 1e-2
| Postprocess.StochasticAssessment.Output.values |
values computed by Postprocess.StochasticAssessment.Assessment
Usually this is a cell array of structure arrays. For cells correspond to the rsamples and the structure array corresponds to the test samples given by M_test.
 1.8.8
1.8.8

