 |
KerMor
0.9
Model order reduction for nonlinear dynamical systems and nonlinear approximation
|
|
KerMor
0.9
Model order reduction for nonlinear dynamical systems and nonlinear approximation
|
User interface to visualize highdimensional functions using two input dimensions and one output dimension. More...
Go to the source code of this file.
Functions | |
| function
varargout = | FunVis2D (varargin) |
| User interface to visualize highdimensional functions using two input dimensions and one output dimension. More... | |
| function | FunVis2D>FunVis2D_OpeningFcn (hObject, eventdata, handles, varargin) |
| function ranges = | FunVis2D>rangesFromATD (data.ApproxTrainData atd) |
| function | FunVis2D>stop (h, errmsg, varargin) |
| function | FunVis2D>newMesh (h, c) |
| function | FunVis2D>updateFX (h, c) |
| function c = | FunVis2D>updateCenterPoints (h, c) |
| function | FunVis2D>updateATDPoints (h, c) |
| function | FunVis2D>plotCurrent (h, c) |
| function | FunVis2D>setDimSliders (h) |
| function | FunVis2D>baseSliderChanged (hObj, h, label) |
| function
varargout = | FunVis2D>FunVis2D_OutputFcn (hObject, eventdata, handles) |
| function | FunVis2D>dim1_Callback (hObject, eventdata, handles) |
| function | FunVis2D>dim1_CreateFcn (hObject, eventdata, handles) |
| function | FunVis2D>dim2_Callback (hObject, eventdata, handles) |
| function | FunVis2D>dim2_CreateFcn (hObject, eventdata, handles) |
| function | FunVis2D>slRefine_Callback (hObject, eventdata, handles) |
| function | FunVis2D>slRefine_CreateFcn (hObject, eventdata, handles) |
| function | FunVis2D>dout_Callback (hObject, eventdata, handles) |
| function | FunVis2D>dout_CreateFcn (hObject, eventdata, handles) |
| function | FunVis2D>slPerc_Callback (hObject, unused1, handles) |
| function | FunVis2D>slPerc_CreateFcn (hObject, eventdata, handles) |
| function | FunVis2D>panelslide_Callback (hObject, eventdata, h) |
| function | FunVis2D>panelslide_CreateFcn (hObject, eventdata, handles) |
| function | FunVis2D>uipushtool2_ClickedCallback (hObject, eventdata, handles) |
| function | FunVis2D>slCenters_Callback (hObject, unused1, handles) |
| function | FunVis2D>slCenters_CreateFcn (hObject, eventdata, handles) |
| function | FunVis2D>rbAdd_Callback (hObject, eventdata, handles) |
| function | FunVis2D>rbErr_Callback (hObject, eventdata, handles) |
| function | FunVis2D>chkGrid_Callback (hObject, eventdata, handles) |
| function | FunVis2D>chkPlotFun_Callback (hObject, eventdata, handles) |
| function | FunVis2D>chkPlotCenterLines_Callback (hObject, unused1, handles) |
User interface to visualize highdimensional functions using two input dimensions and one output dimension.
Definition in file FunVis2D.m.
| function varargout = FunVis2D | ( | varargin | ) |
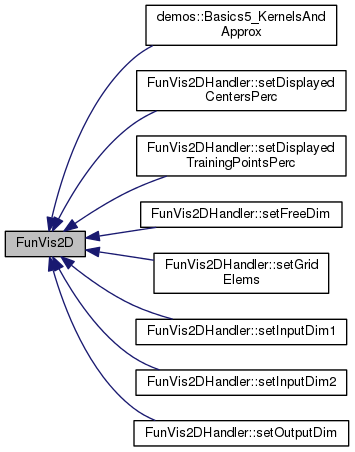
User interface to visualize highdimensional functions using two input dimensions and one output dimension.
This visualization tool can be called with KerMor model instances as well as standalone with any function handle or class instance (that has an evaluate method). For every case, it is assumed to have a function \(f(x,t,\mu)\), where the last two arguments may each or both be left out; depending on the ranges struct (explained below) the according evaluations will be performed. When passing KerMor models those ranges are computed automatically; if one wants to plot arbitrary functions please see the description of the different calling interfaces below.
FunVis2D(fullmodel): Plot the full system's nonlinearity using the bounding box of the sampled trajectory data as plotting limits.
FunVis2D(reducedmodel): Plot the reduced model's nonlinearity (i.e. the approximation) using the approximation training data's bounding box as plotting limits. Additionally, the full model's function can be plotted against it or the error between them.
FunVis2D(fun_handle, ranges): Plots the function given by the function handle fun_handle in the range given by ranges. Ranges must be a struct with at minimum the field xrange. Depending on the structure of the passed function handle, it must also contain a field trange or/and murange if any of the second arguments \(t\) or/and \(\mu\) are expected. So, if you leave out trange but pass murange, the function will be expected to have an interface \(f(x,\mu)\).
FunVis2D(fun_handle, range_matrix): Same as 'FunVis2D(fun_handle, ranges)', but automatically fills the struct ranges with the field xranges equal to the matrix passed. No time/parameter range and arguments.
FunVis2D(class_instance, ranges): Expects the first argument to be a class with an evaluate method, corresponding to the evaluation of the function to plot. The rest behaves like the call 'FunVis2D(fun_handle, ranges)'.
FunVis2D(kexp, ranges, trainingdata): The same as if calling FunVis2D(class_instance, ranges), but with two additional plotting possibilities:
kernels.KernelExpansion subclass, and the centers of it can additionally be drawn in the plot.xi,ti,mui points in conjunction with the evaluations fxi of the full system's nonlinearity at the respective points.FunVis2D(kexp, trainingdata): The same as if calling FunVis2D(kexp, ranges, trainingdata) with the plotting ranges computed automatically from the bounding box of the trainingdata.
FunVis2D(*, *, *, fun2, lbl): Any of the above calls can receive two more arguments. Those must always be the 4th and 5th arguments and any arguments not given before must be passed as [].
fun2: A second function (either handle or class, see above) to compare the main function to. Enables to either add the second function to the plot or plot the error.lbl: Custom labels for the \(x [,t [, mu]]\) and \(f(x[,t[,\mu]])\) dimensions. Must be a struct with the fields x and fx, each a char cell of length equal to the input and output dimensions. If more than just \(x\) is used as function argument, the order is \(x\), \(t\) and \(\mu\) for the input dimensions; the length of the x cell must always equal the sum of all arguments dimensions.[], if no second function is given but custom labels are required.Definition at line 17 of file FunVis2D.m.
Referenced by demos.Basics5_KernelsAndApprox(), FunVis2DHandler.setDisplayedCentersPerc(), FunVis2DHandler.setDisplayedTrainingPointsPerc(), FunVis2DHandler.setFreeDim(), FunVis2DHandler.setGridElems(), FunVis2DHandler.setInputDim1(), FunVis2DHandler.setInputDim2(), and FunVis2DHandler.setOutputDim().
| function FunVis2D>baseSliderChanged | ( | hObj, | |
| h, | |||
| label | |||
| ) |
Definition at line 769 of file FunVis2D.m.
| function FunVis2D>chkGrid_Callback | ( | hObject, | |
| eventdata, | |||
| handles | |||
| ) |
Definition at line 962 of file FunVis2D.m.
| function FunVis2D>chkPlotCenterLines_Callback | ( | hObject, | |
| unused1, | |||
| handles | |||
| ) |
Definition at line 977 of file FunVis2D.m.
| function FunVis2D>chkPlotFun_Callback | ( | hObject, | |
| eventdata, | |||
| handles | |||
| ) |
Definition at line 970 of file FunVis2D.m.
| function FunVis2D>dim1_Callback | ( | hObject, | |
| eventdata, | |||
| handles | |||
| ) |
Definition at line 789 of file FunVis2D.m.
| function FunVis2D>dim1_CreateFcn | ( | hObject, | |
| eventdata, | |||
| handles | |||
| ) |
Definition at line 802 of file FunVis2D.m.
| function FunVis2D>dim2_Callback | ( | hObject, | |
| eventdata, | |||
| handles | |||
| ) |
Definition at line 809 of file FunVis2D.m.
| function FunVis2D>dim2_CreateFcn | ( | hObject, | |
| eventdata, | |||
| handles | |||
| ) |
Definition at line 822 of file FunVis2D.m.
| function FunVis2D>dout_Callback | ( | hObject, | |
| eventdata, | |||
| handles | |||
| ) |
Definition at line 858 of file FunVis2D.m.
| function FunVis2D>dout_CreateFcn | ( | hObject, | |
| eventdata, | |||
| handles | |||
| ) |
Definition at line 870 of file FunVis2D.m.
| function FunVis2D>FunVis2D_OpeningFcn | ( | hObject, | |
| eventdata, | |||
| handles, | |||
| varargin | |||
| ) |
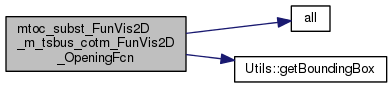
Definition at line 181 of file FunVis2D.m.
References all(), Utils.getBoundingBox(), and X.
| function varargout = FunVis2D>FunVis2D_OutputFcn | ( | hObject, | |
| eventdata, | |||
| handles | |||
| ) |
Definition at line 782 of file FunVis2D.m.
| function FunVis2D>newMesh | ( | h, | |
| c | |||
| ) |
Definition at line 424 of file FunVis2D.m.
| function FunVis2D>panelslide_Callback | ( | hObject, | |
| eventdata, | |||
| h | |||
| ) |
Definition at line 903 of file FunVis2D.m.
| function FunVis2D>panelslide_CreateFcn | ( | hObject, | |
| eventdata, | |||
| handles | |||
| ) |
Definition at line 911 of file FunVis2D.m.
| function FunVis2D>plotCurrent | ( | h, | |
| c | |||
| ) |
Definition at line 567 of file FunVis2D.m.
| function ranges = FunVis2D>rangesFromATD | ( | data.ApproxTrainData | atd | ) |
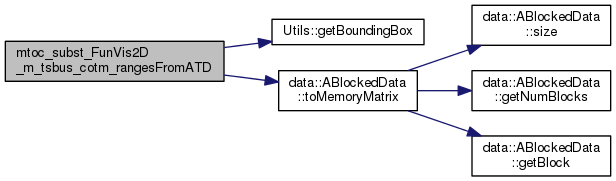
Definition at line 404 of file FunVis2D.m.
References Utils.getBoundingBox(), data.ApproxTrainData.mui, data.ApproxTrainData.ti, data.ABlockedData.toMemoryMatrix(), X, and data.ApproxTrainData.xi.
| function FunVis2D>rbAdd_Callback | ( | hObject, | |
| eventdata, | |||
| handles | |||
| ) |
Definition at line 947 of file FunVis2D.m.
| function FunVis2D>rbErr_Callback | ( | hObject, | |
| eventdata, | |||
| handles | |||
| ) |
Definition at line 954 of file FunVis2D.m.
| function FunVis2D>setDimSliders | ( | h | ) |
Definition at line 682 of file FunVis2D.m.
| function FunVis2D>slCenters_Callback | ( | hObject, | |
| unused1, | |||
| handles | |||
| ) |
Definition at line 925 of file FunVis2D.m.
| function FunVis2D>slCenters_CreateFcn | ( | hObject, | |
| eventdata, | |||
| handles | |||
| ) |
Definition at line 938 of file FunVis2D.m.
| function FunVis2D>slPerc_Callback | ( | hObject, | |
| unused1, | |||
| handles | |||
| ) |
Definition at line 882 of file FunVis2D.m.
| function FunVis2D>slPerc_CreateFcn | ( | hObject, | |
| eventdata, | |||
| handles | |||
| ) |
Definition at line 894 of file FunVis2D.m.
| function FunVis2D>slRefine_Callback | ( | hObject, | |
| eventdata, | |||
| handles | |||
| ) |
Definition at line 834 of file FunVis2D.m.
| function FunVis2D>slRefine_CreateFcn | ( | hObject, | |
| eventdata, | |||
| handles | |||
| ) |
Definition at line 847 of file FunVis2D.m.
| function FunVis2D>stop | ( | h, | |
| errmsg, | |||
| varargin | |||
| ) |
Definition at line 418 of file FunVis2D.m.
| function FunVis2D>uipushtool2_ClickedCallback | ( | hObject, | |
| eventdata, | |||
| handles | |||
| ) |
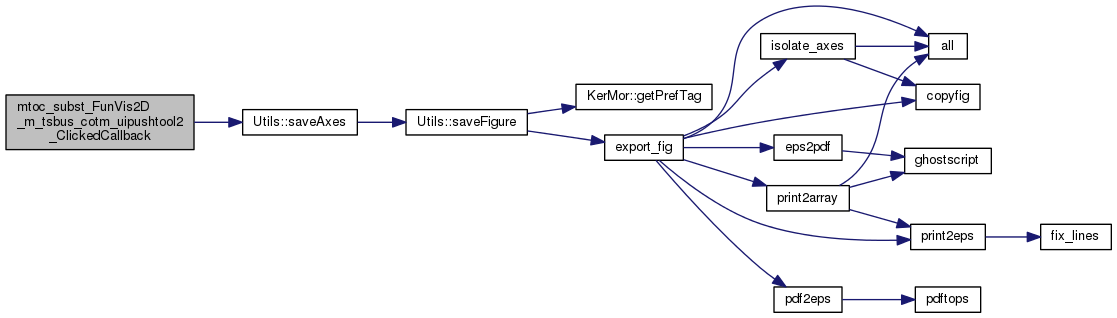
Definition at line 920 of file FunVis2D.m.
References Utils.saveAxes().
| function FunVis2D>updateATDPoints | ( | h, | |
| c | |||
| ) |
Definition at line 542 of file FunVis2D.m.
| function c = FunVis2D>updateCenterPoints | ( | h, | |
| c | |||
| ) |
Definition at line 492 of file FunVis2D.m.
References Utils.findVecInMatrix().
| function FunVis2D>updateFX | ( | h, | |
| c | |||
| ) |
Definition at line 437 of file FunVis2D.m.
 1.8.6
1.8.6 
