 |
KerMor
0.9
Model order reduction for nonlinear dynamical systems and nonlinear approximation
|
|
KerMor
0.9
Model order reduction for nonlinear dynamical systems and nonlinear approximation
|
LogPlot: Class with static functions for logarithmic plotting. More...
LogPlot: Class with static functions for logarithmic plotting.
axis tight if axis limits have already been set manually.This class is part of the framework
Homepage http://www.morepas.org/software/index.htmlDocumentation http://www.morepas.org/software/kermor/index.htmlLicense KerMor license conditions Static Public Member Functions | |
| static function handle p = | nicesurf (handle h,matrix< double > X,matrix< double > Y,matrix< double > Z, varargin) |
| Creates a nice surface plot with the given data. More... | |
| static function handle p = | nicesurfc (handle h,matrix< double > X,matrix< double > Y,matrix< double > Z, varargin) |
| Creates a nice surface plot including a contour with the given data. More... | |
| static function handle p = | logsurf (handle h,matrix< double > X,matrix< double > Y,matrix< double > Z, varargin) |
| Creates a nice surface plot in a logarithmic scale with the given data. More... | |
| static function handle p = | logsurfc (handle h,matrix< double > X,matrix< double > Y,matrix< double > Z, varargin) |
| Creates a nice surface plot including a contour with the given data in a logarithmic scale. More... | |
| static function handle p = | logtrisurf (handle h, tri,rowvec< double > x,rowvec< double > y,rowvec< double > z, varargin) |
| Creates a surface plot from a 2D triangulation in a logarithmic scale. More... | |
| static function handle p = | cleverPlot (handle ax,rowvec< double > x,rowvec< double > y, varargin) |
| Calls corresponding plot routines depending on the scale of data. More... | |
|
static |
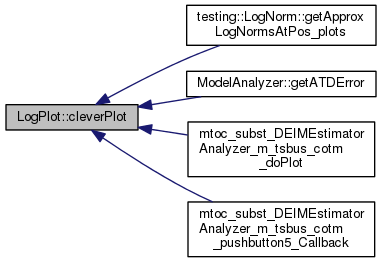
Calls corresponding plot routines depending on the scale of data.
| ax | The axes handle to plot to |
| x | The x values |
| y | The y values |
| varargin | Any further arguments are passed to the plot function. |
| p | The object(s) created by the plot function |
Definition at line 158 of file LogPlot.m.
References all().
Referenced by testing.LogNorm.getApproxLogNormsAtPos_plots(), ModelAnalyzer.getATDError(), DEIMEstimatorAnalyzer>doPlot(), and DEIMEstimatorAnalyzer>pushbutton5_Callback().
|
static |
Creates a nice surface plot in a logarithmic scale with the given data.
| h | The axes handle to plot to |
| X | The X data matrix |
| Y | The Y data matrix |
| Z | The \(Z = \vf(X,Y)\) value matrix |
| varargin | Any further arguments are passed to surf. |
| p | The patch object created by surf |
Definition at line 79 of file LogPlot.m.
References nicesurf(), X, and Y.
Referenced by testing.DEIM.compareDEIM_Full_Jacobian_plots(), testing.LogNorm.compareSimTransDEIMJac_FullJac_plots(), testing.LogNorm.compareSimTransJac_FullJac_plots(), testing.DEIM.getDEIMReducedModelErrors_plots(), testing.DEIM.getTrajApproxErrorDEIMEstimates_plots(), and approx.algorithms.Componentwise.plotSummary().

|
static |
Creates a nice surface plot including a contour with the given data in a logarithmic scale.
| h | The axes handle to plot to |
| X | The X data matrix |
| Y | The Y data matrix |
| Z | The \(Z = \vf(X,Y)\) value matrix |
| varargin | Any further arguments are passed to surf. |
| p | The patch object created by surfc |
Definition at line 107 of file LogPlot.m.
References nicesurfc(), X, and Y.
|
static |
Creates a surface plot from a 2D triangulation in a logarithmic scale.
| h | The axes handle to plot to |
| tri | The triangulation data, connecting the points given in the x,y variables. |
| x | The x values |
| y | The y values |
| z | The \(z = \vf(x,y)\) values |
| varargin | Any further arguments are passed to trisurf. |
| p | The patch object(s) created by trisurf |
Definition at line 136 of file LogPlot.m.
Referenced by testing.DEIM.getDEIMErrorsAtXForParams_plots(), and testing.DEIM.plotDEIMErrs().
|
static |
Creates a nice surface plot with the given data.
| h | The axes handle to plot to |
| X | The X data matrix |
| Y | The Y data matrix |
| Z | The \(Z = \vf(X,Y)\) value matrix |
| varargin | Any further arguments are passed to surf. |
| p | The patch object created by surf |
Definition at line 41 of file LogPlot.m.
Referenced by testing.LogNorm.compareSimTransDEIMJac_FullJac_plots(), testing.LogNorm.compareSimTransJac_FullJac_plots(), and logsurf().

|
static |
Creates a nice surface plot including a contour with the given data.
| h | The axes handle to plot to |
| X | The X data matrix |
| Y | The Y data matrix |
| Z | The \(Z = \vf(X,Y)\) value matrix |
| varargin | Any further arguments are passed to surf. |
| p | The patch object created by surfc |
Definition at line 60 of file LogPlot.m.
Referenced by logsurfc().
 1.8.6
1.8.6 
